Manipulating Data with R
- This code builds off the file built here: https://medium.com/@FrenchTrevor/reading-files-into-and-out-of-r-a5bc6fded44b
- Full code can be found at the bottom of the page.
- Video here: https://youtu.be/qK9hM9oEocM

Add a Column to a Dataframe
This snippet demonstrates how to add a column to a dataframe in R. Specifically, this code creates a new dataframe called “df” from an existing dataframe called “rawExcel” and adds a column called “Pay Raise” which is equal to the value of “Base Salary” * .05.
#Add a pay raise column equal to 5% of base Salary
df <- rawExcel %>%
  mutate(rawExcel, "Pay Raise" = rawExcel$`Base Salary` * .05)
View(df)
Order Data by a Specified Column’s Value
This snippet demonstrates how to order any given column by ascending or descending values.
#Order data by a specified column's value
ascPay <- arrange(df, `Pay Raise`)
View(ascPay)
descPay <- arrange(df, desc(`Pay Raise`))
View(descPay)
Add a New Row to a Dataframe
Adding a new row to a dataframe in R requires you to do two things. First, you’ll have to create a variable which contains the data for the new row. In this snippet, we’ve called that variable “new_row”. Second, you’ll need to bind that new row to your desired dataframe. We’ve bound our new_row variable to our “df” dataframe and called the resulting dataframe “addRow”.
#Add a new row
new_row <- c(11, 3600, 1800)
addRow <- rbind(df, new_row)
View(addRow)
Order Data by Multiple Columns
After adding the new row, we are left with two observations with the same “Pay Raise” data. Because of this, we’ll want to sort on a secondary variable. This snippet still sorts the data on the “Pay Raise” column, but it also tells the program to sort on “Employee #” given the “Pay Raise” numbers are the same.
#Order data by multiple columns
ascPay <- arrange(addRow, `Pay Raise`, `Employee #`)
View(ascPay)
descPay <- arrange(addRow, desc(`Pay Raise`), `Employee #`)
View(descPay)
Exclude Columns from Your Data
This snippet creates a new dataframe which only includes the “Employee #” and the “Pay Raise” columns, omitting the “Base Salary” column.
#Exclude columns from your data
lessColumn <- subset(df, select = c("Employee #", "Pay Raise"))
View(lessColumn)
Filter Observations by Value
This snippet creates a variable called “midLine” which establishes the median pay of the organization. We then use that variable to create a dataframe which only includes the top half of earners along with a dataframe which only contains the bottom half of earners.
#Filter observations by value
midLine <- median(df$`Base Salary`)
topEarners <- subset(df, `Base Salary` > midLine)
View(topEarners)
bottomEarners <- subset(df, `Base Salary` < midLine)
View(bottomEarners)
Add a New Column with Values Which Are Dependent on the Values of Another Column
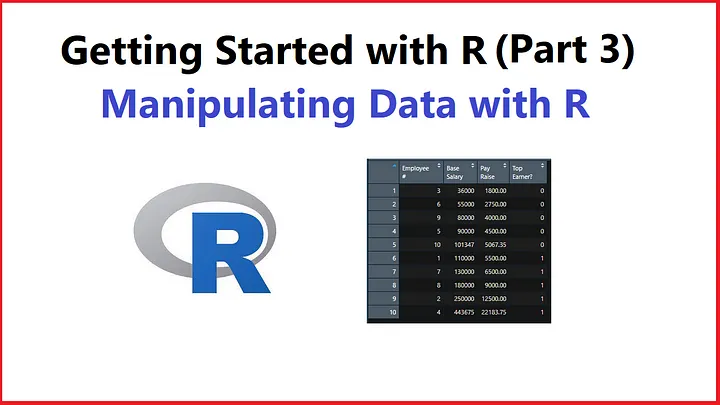
This snippet creates a column called “Top Earners?” and it’s value will be set to “1” if “Base Salary” is above the median or “0” otherwise.
#Add a new column with values dependent on the values of another column
dependentColumn <- df %>%
  mutate("Top Earner?" = if_else(df$`Base Salary` > midLine, 1, 0))
View(dependentColumn)
Full Code
#Clears environment
rm(list = ls(all.names = TRUE))
#-------------------------------------------------------------------------------
#-----------------------------------LIBRARIES-----------------------------------
#-------------------------------------------------------------------------------
library(readxl)
library(dplyr)
library(writexl)
#-------------------------------------------------------------------------------
#---------------------------------DATA SOURCES----------------------------------
#-------------------------------------------------------------------------------
#Set your working directory
wd <- "C:/Users/Frenc/OneDrive/Desktop/"
#Set path to an Excel file
excelFile <- paste(wd, "input.xlsx", sep='')
#Set path to a CSV file
csvFile <- paste(wd, "input.csv", sep='')
#Read Excel file into R and view it
rawExcel <- read_excel(excelFile)
View(rawExcel)
#Read CSV file into R and view it
rawCSV <- read.csv(csvFile)
View(rawCSV)
#-------------------------------------------------------------------------------
#------------------------------DATA MANIPULATION--------------------------------
#-------------------------------------------------------------------------------
#Add a pay raise column equal to 5% of base Salary
df <- rawExcel %>%
  mutate(rawExcel, "Pay Raise" = rawExcel$`Base Salary` * .05)
View(df)
#Order data by a specified column's value
ascPay <- arrange(df, `Pay Raise`)
View(ascPay)
descPay <- arrange(df, desc(`Pay Raise`))
View(descPay)
#Add a new row
new_row <- c(11, 36000, 1800)
addRow <- rbind(df, new_row)
View(addRow)
#Order data by multiple columns
ascPay <- arrange(addRow, `Pay Raise`, `Employee #`)
View(ascPay)
descPay <- arrange(addRow, desc(`Pay Raise`), `Employee #`)
View(descPay)
#Exclude columns from your data
lessColumn <- subset(df, select = c("Employee #", "Pay Raise"))
View(lessColumn)
#Filter observations by value
midLine <- median(df$`Base Salary`)
topEarners <- subset(df, `Base Salary` > midLine)
View(topEarners)
bottomEarners <- subset(df, `Base Salary` < midLine)
View(bottomEarners)
#Add a new column with values dependent on the values of another column
dependentColumn <- df %>%
  mutate("Top Earner?" = if_else(df$`Base Salary` > midLine, 1, 0))
View(dependentColumn)
#-------------------------------------------------------------------------------
#-------------------------------OUTPUT NEW FILE---------------------------------
#-------------------------------------------------------------------------------
#Set path to write Excel file
excelOut <- paste(wd, "output.xlsx", sep = '')
#Set path to write CSV file
csvOut <- paste(wd, "output.csv", sep = '')
#Write Excel file
write_xlsx(df, excelOut)
#Write CSV file
write.csv(df, csvOut, row.names = T)